
Documentation of the GDX-Editor
2 Moving sets in rows and columns
3 Selection of elements in the sets
5 Editing element names in rows and columns
7 Changing element names (Uels)
8 Adding a new symbol to the gdx file
12 Statistics and comparison of values
12.1 How to activate statistic functions
Selection of symbols

If you open a gdx file, you see the sets, parameters, variables, equations and aliases which are stored in the gdx file on the left hand. In the column "Symbol" the domains of the symbol are given. For example rep is declared with 4 domains and
sslack is declared with the domain i.
If you doubleclick on rep you will see the four domains. They are all declared to be free and declared with an asterix (*). You can distinguish them, because they are called "rep_Set1" - "rep_Set4".
Moving sets in rows and columns

You can shift the sets to another position in the rows or to the columns by clicking on the headline of a set (for example on the button "rep_Set2") and dragging it to the new position. In this example we have the row dimensions Set1 and Set3 and the Column dimensions Set4 and Set2. These are reflected in the table.
So our rows begin with "b1" from Set1 and "seattle" from Set3. The columns begin with "new-york" from Set4 and "x.l" from Set2.
Selection of Elements in the sets

You can mark one or several elements per domain. Here we have an equation defcut(nb). This equation has only one domain but also the attributes level, margin, lower bound, upper bound and scale.
In the example on the left, we selected b2, b4 and b6 from the domain "NB" by keeping the control button on the keyboard pressed and marking the 3 element names b2, b4 and b6.
Additionally we selected the attributes level, margin and scale.

There is another possiblity to select elements by right-clicking on the button "NB". Here we can select subset-elements.
This is always possible if you declared a set as a subset of "NB" in your GAMS project
For example by declaring NBA as follows:
Set NBA(NB) /b1,b2/;
Editing single values

The gdx-Editor allows you to change values. You have simply to click on a value and enter another value. If you click "save" or run a GAMS job, the changes will be written into your gdx file.
In some cases you cannot change the values of sets. This happens, if you want to change the value of a set element with one dimension, which is a domain of another symbol in gdx-file. To change such an element would lead to gdx-errors.
Editing element names in rows and columns

In some cases you can choose the element names in rows and columns. If the element name belongs to a domain "*", like in this case, you can choose any name.
But if the domain is a subdomain of another domain you can only choose those elements, which are part of the mother-domain.
If you change the element names in a row and then click on another row the changes will be saved. If the logical position of the changed row differs from the genuine one, the row will disappear and re-appear at the new position. This might lead to confusions.
In this case it is a good idea to activate "Show all combinations of keys in domains" in the tab "Show & hide" and maybe to sort the element names.

In some cases you cannot choose another element. This is the case if there are values defined for all element combinations in the mother domain. In the example on the left, we have 2 sets, the first one with 2 elements, the second one with 3 elements. In the gdx-file all combinations of values are already present, so that no element combination could be added.
In these cases the element names cannot be changed, so that no drop down list will appear if you click on them.
Adding new rows and columns

If you have a table, in which not all possible column or row combinations are already defined, you can add a new row or column by clicking on "Add Rows..." or "Add Columns...".

A new row will be added. The default name of the new row is "", which is displayed as "<Empty>". The default value is "N" for sets. For other symbol types, the default value for new cells is 0.
You can click on a element name ("<Empty>") to define the new element name and on the value to define the new value.
In the end you can click on "Add Rows..." to accept and to add another row. Or you can simply click on "Accept" or "Cancel".
For further information about changing element names and values please see "Editing element names in rows and columns" and "Editing single values".
Changing element names (UELs)

You can change the element names (in the GAMS gdx API called "UEL") by clicking on the green button "Change Element Names (UELs)...".
On the right side you will see the current element names. If you change for example "seattle" into "paris", this new uel will be shown in all places where "seattle" stood before.
You can also add new UELs, but these will only be shown if you use add them to a table in your gdx file.
Adding a new symbol to the gdx file

If you want to add a new symbol to the gdx file, please click on the green button "+ Add Symbol...".
You can enter the symbol name and a description. The symbol type can be chosen from a drop down menu, for example "Parameter". You can also choose the number of dimensions.
On the right side you see the domain list. We selected 3 dimensions, so in the domain list 3 domains can be selected. The default is "*". But you can choose any domain which is present in the gdx file.
The GDX-search bar

Search rows & columns
Search values
Symbols & domains
Search all open files
Project directory
Search UELs (unique elements name) in the columns and rows of the current symbol
Search inside the shown values of the current symbol
Search symbols and their domains in the current file. If you search in a gdx-file, which contains a set "anyreg" and another set, defined as "set reg(anyreg)" for those symbol and domains, which contain the phrase "any", not only the symbol "anyreg" will be found, but also the first domain of the symbol "reg"
Search symbols and their domains in all opened gdx-files (ctrl+shift+F)
Search symbols and their domains in project directory and sub- folders

Button up: Searches also inside words / Button down: search for whole words only

Button up: ignore case / Button down: case sensitive

Search previous appearance

Search next appearance
Merging gdx files

If you run scenarios and want to compare the resulting gdx files you can do this very easily by merging the files. One dimension for naming the scenario will be added to all symbols in the gdx files.

You can add new files by clicking on the button "Add File(s)...".
They will appear in the list of files. In the text box you see the scenario name, which is "transport" in this case. You can change the name if you want.
The checkbox "Compress merged gdx file" means that the result file will be compressed in a format, which is readable for GAMS as well.
If you click on "Merge and save as new gdx file..." the selected files will be merged and displayed in the gdx editor.
Gdx formatting

You can change the appearence of your result table by clicking on the "Formatting" tab in the bottom bar.
On the left side you can format the column headers, rows headers and values (values = "Regular Cells").
On the right side you can change the "Decimals" and choose if you want a point or a comma to separate the decimals.
You can activate the checkbox "1000 Separator", so that a number 10000.0 will be shown as 10,000.0.
Statistics and comparison of values

How to activate statistic functions

On the left side you see the "Current Functions", for example minimum, maximum, mean and median. You can change the order by clicking "Up" or "Down" or remove functions.
In the next listbox you can choose further functions and add them to the current functions.
The current functions will be shown in the gdx-Editor. Each column is interpreted separately and the results are updated whenever the user changes a setting or the order of elements.
Adding percentiles to statistics

In the following box you can add a percentile, which will be added to the current functions. The value must be between 0 and 100 [%].
Comparing columns

In the "Comparer" you can choose between
1. Don't Compare Columns,
2. Compare with Previous: The value of each cell is compared with the value of the cell in the previous column,
3. Compare with Column...: You can choose a column, with which all other columns are compared.
In the box "Comparer: Show" you can activate or deactivate options as "Show Values", "Show Absolute Difference" and "Show Relative Change". For example you might only want to see relative changes
of your values. In this case you would deactivate "Show Values" and "Show Absolute Difference".
Sorting elements
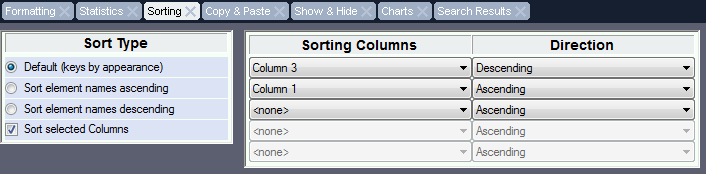
You can sort the table by name (ascending or descending) by selecting the sort type on the left.
If you activate the checkbox "Sort selected Columns" you have also the oportunity to sort the columns by values.
In this example we sort as a first order the column 3 descending and as a second order the column 1 ascending.
You can also combine the sorting by value and name.
Copy and paste
Copy options
Maybe you know the problem that you copy a table from excel as a table into the GAMS IDE with the result, that you have to insert points between the element names, that you have to shift all the values to the right position and if you refresh your excel file, you have to do everything again - which might lead to errors. In the GMS-Manager instead, you have many possiblities to copy your values and element names.

On the left side, you can choose the copy options for the values. You can copy them with headers, without headers and with hidden headers (see Show & Hide).
In the Statistics tab, you can activate the comparison of columns. If you want to copy the selected relative or absoulte differences, please activate "Copy including selected column comparison". In this case, the values will be copied as string values, not as numbers.
On the right side, you can choose how to copy the element names. In the normal case, you would copy them using tabs between element names and values. But if you want to copy them into a text file, you might want to "using empty spaces instead of tabs". In this case the spaces will be in the right table format.
A third option is to copy the values "in GAMS table style". In this case the tabs between the values are replaced by spaces and the element names in the row part are seperated with a point.
If you want to copy a table, of which some element names contain spaces, it might be useful to select "Copy column and row names in quotes", so that if you copy in GAMS table style, the information is not misinterpreted by the GAMS compiler.
Copy a table content

If you want to copy the values in your table you can simply mark the desired content, click the right mouse button and select "Copy" or "Cut", if you like to cut the content.
Depending on the Copy options, the headers will be copied as well or be ignored.
Paste values into a table

If you want to paste values into a table, they must be formatted in the right way. The values must be separated with tabs, not with spaces (attention: If you copy data from one gdx table into another, the Copy options must be
"Copy table using tabs between element names and values").
You can either rightclick on one table cell and select "paste" or select a couple of cells and click "paste". If you select more than one cell, the numbers of rows and columns must be equal to the content in the clipboard.
There are 2 options of cell contents in the clipboard: one is with headers, one without. If you copy your values without headers, they will be pasted into your table, starting with the selected cell.
Paste options for pasting table content with element names

If you copied the values of your table with headers and want to paste them into the current table, you will be asked, if you want to ignore the column and row names in the clipboard or consider them.
Here we have an original table on the left with Element names "Element1" - "Element6".
We want to paste the clipboard content with "Element1", "Element3" and "Element8".
So there are 2 ways of pasting the clipboard content. The first way is to ignore the element names. In this case the content will be pasted into the table, starting at the selected cell ignoring the column names.
If we consider the element names, the rows with the elements "Element1" and "Element3" will be replaced and the "Element8" will be added to the table.
Show & hide options
If you want to find out the arithmetic mean of your values, it is important to define if a zero should be treated as a number. For example, if you have two numbers 10 and 0, the mean is 5, but if 0 is not treated as a number, the mean value is 10.
GMS-Manager gives you several options to hide values, which will not be treated as numbers.

On the left hand you can choose if you want to show only the combinations which exist in the gdx file (the default and only possiblity in the GAMS gdx viewer). But if you want to show all combination of present keys, you will see more values:

In this example "Only show those combinations which exist in the gdx file" is selected. You can see, that b1 and b2 is missing and the values start with "b3 - chicago".

"Show all combinations of present keys" shows also those rows, which are market with a "N". So b1 and b2 are still missing, but we have the combinations of all present keys in the table. For example, we have b3, b4 and b7 present in the first column and new-york, chicago and topeka in the second.

"Show all combinations of keys in domain" shows also b1 and b2, because they are part of the domain NB, even if all values are "N". This is very helpful if you want the values. Imagine, you want to change your GDX-file, so that in dslcc, the combination "b1 - chicago" is activated. In this case, you can easily see all present combinations and change the respective value.

Imagine, you have only selected "b3" in the first row and want to make a presentation which shows all the values for this selection only. In this case you might not want to show the "b3"always in the first column. This can be done by selecting "Hide domains with only one element selected".
Charts

Switching between the views

You can easily switch between table view and chart view by clicking on this button. The columns, rows and the selection of element names will be equal in both views. If you change them in one view and switch the view by pressing the button, you will be able to see the same results in a graphical / numerical way.
Chart options

On the left hand you can define the diagram title and the captions of the x- and y-axis.
The font can be chosen for the title, the lables and the x - and y-axis.
On the right hand you see the options for defining the chart type.
Chart type

There are 4 types of bar charts. The normal bar charts are square, while the cylinder bar charts are round. They can be displayed in a vertical or horizontal way.
The normal bar charts can be displayed in 3d style or plain, while the cylinder bar charts are always 3 dimensional.
Other options are point charts and line charts, which are always 2 dimensional.
Chart ordering

Bar charts can be displayed in 4 different ways: As one row, clustered, tower charts and 100% tower charts.
One row

"One Row" displays the columns separately, while the row elements are displayed close to each other in different colors.
Clustered

"clustered" displays the columns on the x axis, while the different rows are displayed on a z axis in different colors.
Tower chart

"Tower charts" displays the columns on the x axis, while the different rows are displayed as towers on the y axis in different colors.
100% tower chart

"100% tower chart" displays the columns on the x axis, while the different rows are displayed as towers on the y axis, adding to 100% in different colors. Negative values are displayed in the direction of the bottom, while positive values are directed to the top.